Increase the Revenues of Your Waste Company With the Tips Shared in Our Blog Articles
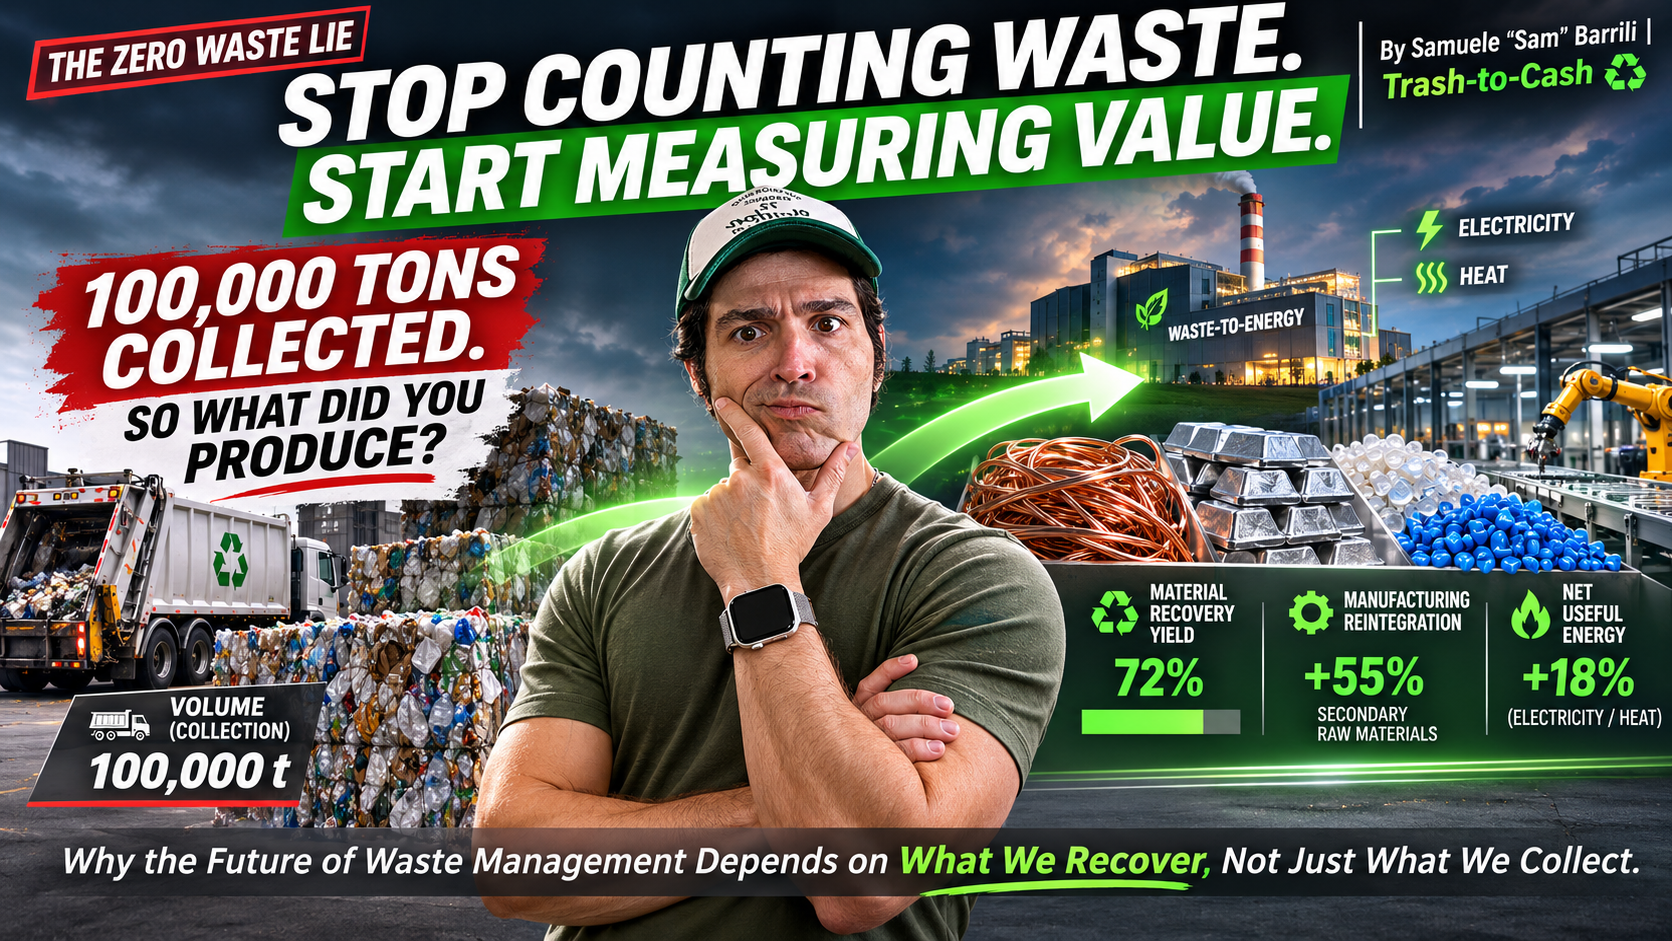
STOP COUNTING WASTE. START MEASURING VALUE.
Why the Future of Waste Management Depends on What We Recover, Not Just What We Collect
"We Collected 100,000 Tons." So What?
Every year, somewhere, a waste company publishes some version of the same sentence:
"We collected 100,000 tons of waste this year."
It goes into the annual report. It goes into the sales deck. It goes into the press release, usually next to a photo of a clean truck.
So what?
I am not dismissing the achievement. Collection is hard. It takes trucks, drivers, routes, permits, contracts, safety systems and working capital. Without logistics, nothing downstream exists.
But that number tells me how much material the company moved. It tells me almost nothing about what that material became.
How many of those 100,000 tons left the gate as copper, aluminum, fiber or polymer that a manufacturer would actually buy? How much of the residual fraction became electricity or heat that someone actually used? And how much was simply transported from one place to another, at a cost, before being buried?
A logistics number is not a value number. For decades, our industry has treated it as if it were.
How the Industry Learned to Measure the Wrong Things
The metrics we celebrate were built for a sector whose job was to make waste go away. Each one measures something real. None of them, on its own, measures resource productivity.
Tonnage collected measures logistics capacity and market share. Service coverage measures access. Landfill diversion measures where waste did not go, not what it turned into. Collection and sorting rates measure behavior at the source and separation at the plant. Facility throughput measures how hard the assets are working. Zero Waste commitments measure intent.
The confusion gets worse when different indicators are quoted as if they were interchangeable. They are not:
Separate collection rate: the share of municipal waste collected in separate streams. It describes how waste enters the system.
Recycling rate: the share of municipal waste that reaches recycling under a defined calculation method. It describes what happens to that same waste after treatment.
Recycled input (recycled content) rate: the share of a given material or product input that comes from secondary sources. It describes a manufacturer's supply.
Circular material use rate: the share of an entire economy's material use that comes from recycled materials. Its denominator includes construction minerals, fossil fuels, biomass and metal ores.
Different numerators. Different denominators. Different scopes. Subtracting one from another produces a number that means nothing.
What Really Happens After We Collect Waste?
Follow a ton of recyclables through the chain: collection, sorting, cleaning, treatment, refining, manufacturing. At every step, mass is lost, quality is graded, and value is either created or destroyed.
Three rules every operator should keep in front of them:
"Collected" does not mean "recycled." Contamination, moisture, mixed materials and rejected loads all fall out between the curb and the reprocessor.
"Sorted" does not mean "recovered." A bale that misses a buyer's specification is not a secondary raw material. It is a liability waiting for a discount.
"Recovered" does not always mean "reintroduced into domestic manufacturing." Material can be recovered and then exported, downgraded, stockpiled or used in low-value applications.
The chemistry is unforgiving. Copper recovered from cable scrap is valued by purity and alloy content; tin, lead or insulation residue push it down the grade ladder or out of the market entirely. Aluminum has to be segregated by alloy family, because cast and wrought alloys are not interchangeable and a contaminated melt costs the smelter money. Plastics must be separated by polymer, color, additive load and, for food-contact uses, by traceable origin; a bale of mixed rigids is not a feedstock. Electronic waste concentrates copper, gold, palladium and critical metals into complex assemblies that only specialized treatment chains can unlock.
The global e-waste numbers show how wide the gap is. According to the UN's Global E-waste Monitor 2024, the world generated a record 62 million tonnes of e-waste in 2022, and only 22.3% of it was documented as formally collected and recycled in an environmentally sound manner. Europe led, at 42.8%.
When you hear "recycled," ask the follow-up question: into what, by whom, and to which specification?
Case Study: Italy
Italy is one of the most advanced waste systems in Europe, and the data confirms it.
According to ISPRA's Rapporto Rifiuti Urbani 2025, Italy's separate collection of municipal waste reached 67.7% in 2024, with 74.2% in the North, 63.2% in the Center and 60.2% in the South. Municipal waste generation was just over 29.9 million tonnes, and landfill accounted for 14.8%.
According to Eurostat, Italy's circular material use rate was 21.6% in 2024, third in the EU behind the Netherlands (32.7%) and Belgium (22.7%), against an EU average of 12.2%.
These two figures measure entirely different things. The first is the share of municipal waste collected separately. The second is the share of all materials used by the Italian economy that come from recycled sources. You cannot subtract 21.6 from 67.7 and call the difference "lost material." That calculation is wrong.
What the comparison does show is more interesting. Even a country that collects well, recycles well and outperforms most of Europe on circularity still draws most of its material use from primary sources. The 2026 Report on the Circular Economy in Italy, presented with ENEA, described Italy as an EU circularity leader that nonetheless remains the most dependent on material imports among the major EU economies.
Italy is not a recycling failure. It is proof that excellent collection is necessary but not sufficient. Once collection works, the bottleneck moves downstream: to treatment, quality, secondary raw material markets and industrial uptake.
Case Study: The United States
The most widely cited U.S. national figures come from the EPA's Advancing Sustainable Materials Management: Facts and Figures report, and they describe 2018.
That year, the U.S. generated about 292.4 million tons of municipal solid waste. Roughly 69 million tons were recycled and 25 million tons composted, a combined 32.1% recycling and composting rate. About 146 million tons, 50%, were landfilled, and about 11.8% was combusted with energy recovery.
The date matters. EPA itself states that its Facts and Figures are current through calendar year 2018. The agency has since published material-specific estimates in its recycling infrastructure work, but no comprehensive nationwide update of the same series. In other words, America's headline recycling number is a photograph several years old.
The more strategic data sits with the U.S. Geological Survey. In its Mineral Commodity Summaries 2026, USGS estimates that copper recovered from scrap contributed about 30% of U.S. copper supply in 2025, while net import reliance for copper rose to an estimated 57% of apparent consumption. Of that scrap-derived copper, about 160,000 tons came from old, post-consumer scrap and about 760,000 tons from new manufacturing scrap. For aluminum, about 3.6 million tons were recovered from purchased scrap in 2025, 44% of it from old scrap, while net import reliance stood around 60%. For iron and steel scrap, USGS reports a recycling rate averaging between 80% and 90% over the past decade.
Read those numbers as an operator. Steel shows what a mature secondary loop looks like. Copper and aluminum show a country that still imports a large share of what it consumes, while post-consumer scrap supplies a comparatively small share of the metal.
I will not pretend to know exactly how many tons of American post-consumer material end up in American furnaces. Nobody publishes that number with confidence, which is exactly my point. Secondary raw materials are now a question of supply security and domestic manufacturing capacity, not only of waste diversion.
From Recyclables to Secondary Raw Materials
The business changes the moment an operator stops thinking like a collector and starts thinking like an industrial supplier.
A collector sells a service: removal. A supplier sells a product: material with a defined composition, delivered on a defined schedule, with documentation a manufacturer's quality department will accept.
That shift brings in a different set of disciplines: purity and composition measured, not guessed; supply consistency month after month; traceability from intake to shipment; contracts with industrial buyers rather than spot sales to whoever answers the phone; price premiums where quality and reliability genuinely justify them; and domestic substitution of virgin feedstock where the economics work.
The principle is simple: sell to the manufacturer's specification, not to your own idea of what the material is. Scrap specifications, end-of-waste criteria and buyer acceptance standards exist for a reason. They are the language of the customer.
Two indicators make this measurable.
Material Recovery Yield = Marketable Recovered Material / Relevant Incoming Material × 100
Scope: calculate it per stream (copper-bearing, aluminum, PET, fiber), never for "all waste." "Marketable" means material that meets a buyer's specification and was sold or committed under contract, not material sitting in the yard. Documentation: weighbridge records, stream-level mass balances, lab assays or composition analysis, and sales records. Limitation: it is a mass ratio. It does not capture grade or price, so pair it with revenue per ton.
Verified Manufacturing Reintegration = Recovered Material Confirmed as Used in Manufacturing / Relevant Recovered Material × 100
Scope: only material with documented evidence of use in production counts. Report domestic and export destinations separately. Documentation: offtake contracts, buyer confirmations of use, end-of-waste declarations where applicable, and chain-of-custody records. Limitation: visibility often stops at the first buyer, especially when traders sit in the chain. Be honest about "confirmed" versus "presumed."
What About Non-Recyclable Waste?
Some residual waste cannot reasonably be recycled. For suitable streams, energy recovery has a legitimate role. But burning waste and generating net useful energy are not the same thing.
The questions that matter are concrete. How much net electricity was exported after subtracting the plant's own parasitic consumption? How much useful heat was actually delivered to a real customer, such as a district heating network or an industrial process? Does the plant run as combined heat and power? What is its overall efficiency? How robust are its emissions controls? What happens to its residues: bottom ash, from which ferrous and non-ferrous metals can often be recovered, and air pollution control residues, which typically require careful handling as hazardous waste? And does the plant work economically, on gate fees, energy prices and heat offtake?
The indicator I use:
Net Useful Energy Yield = Net Useful Energy Delivered / Tons of Residual Waste Treated
Report electricity in kWh(e) per ton and heat in kWh(th) per ton, separately. Do not add them together unless you convert both to a consistent basis. Electricity and heat do not have the same value; the EU's R1 energy-efficiency formula, for example, weights them with different factors for exactly that reason.
And not every non-recyclable ton belongs in an energy recovery plant. Calorific value, moisture, chlorine content, technical feasibility, emissions, permits, the applicable waste hierarchy and the economics all decide whether it is the right route.
The Metrics That Should Matter to Operators and Investors
Here is the scorecard I would put in front of any owner, board or investment committee:
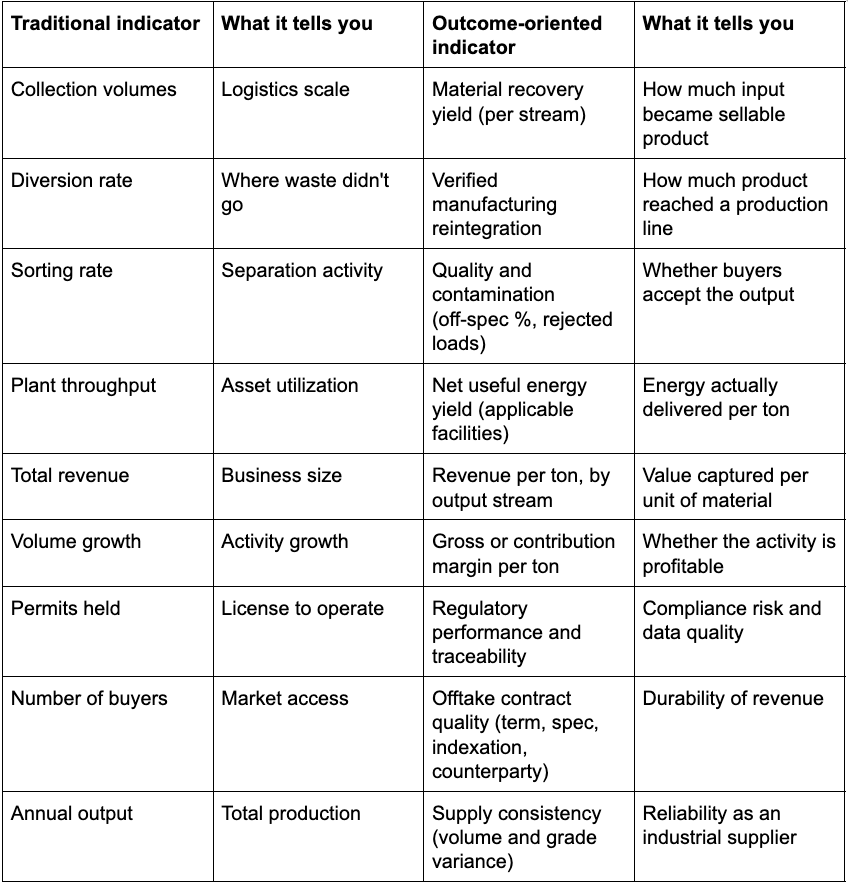
Let me be clear about what this scorecard is not. EBITDA, cash flow, return on invested capital and contract quality remain the center of any financial valuation. There is no universal "recovery-based" valuation model that financial markets have adopted.
My argument is narrower and more practical: material recovery and energy productivity are among the drivers of those financial outcomes. An operator who measures them can manage them. An operator who does not is flying on tonnage alone.
The Competitive Advantage
In a commodity market, the company that can prove what it sells has leverage.
Operators who can document the quality, quantity, consistency, traceability and marketability of their outputs can position themselves differently. They can negotiate industrial offtake agreements instead of chasing spot prices. They can reduce some of their exposure to commodity swings and buyer rejections. They can move into specialized treatment where fewer competitors have the capability. They can extract more from existing assets by improving yield rather than adding trucks. They can diversify into new material products. And they can build operational resilience, because a business with documented output and contracted buyers is harder to disrupt.
None of this guarantees higher margins or higher valuations. Markets, capital costs, regulation and execution all matter. But it changes the conversation from "how much do you haul?" to "what do you produce?" That is a much stronger conversation to be in.
Why Zero Waste Is the Wrong Finish Line
Zero Waste is an aspiration. Resource recovery is an industrial outcome. They are not the same thing, and treating them as if they were has distorted how we measure success.
Nor are Zero Waste, Net Zero, recycling and resource recovery technically synonymous. Zero Waste is a target about residual waste. Net Zero is about greenhouse gas balance. Recycling is a set of processes. Resource recovery is the result: materials and energy returned to productive use.
My critique is not that waste reduction is wrong. It is that a target defined by disappearance can be met in ways that create very little value. Material can leave a balance sheet through export, downgrading or combustion without useful energy, and the "zero" still looks good on a slide.
The real question is not simply whether waste remains. It is how effectively recoverable resources are preserved, transformed and returned to production.
The real success of waste management is not what disappears from the waste stream. It's what returns to the production line.
The Zero Waste Lie
This argument does not end with a scorecard. It goes to the assumptions underneath the entire sector.
That is why I wrote The Zero Waste Lie. My background is in toxicological chemistry, and I have worked in waste management since 2009, advising waste-related companies across different international markets. Over that time, I have watched the industry adopt a language of targets and slogans while the harder questions about material quality, industrial reintegration, natural resources and economic reality stayed in the background.
The book challenges the limitations of simplistic Zero Waste narratives and puts the focus back where it belongs: on what we measurably recover, what manufacturing actually takes back, and what that means for resource management and the economics of the business.
Read the Rest of the Equation
If you still measure success by how much waste disappears, you're missing the most important part of the equation: what those materials become.
In The Zero Waste Lie, I challenge the assumptions behind one of the most repeated ideas in modern waste management and explain why the future depends on recovering and reintroducing valuable resources into production.
If you're a business owner, investor, industry professional, or simply someone who wants to understand what's really happening beyond the headlines, this book will give you a different perspective.
Get your copy of The Zero Waste Lie on Amazon today.
To Your Success
Sam
The Waste Management Alchemist
Sources
ISPRA, Rapporto Rifiuti Urbani – Edizione 2025 (2024 data), press release of December 11, 2025: separate collection, municipal waste generation, landfill share. isprambiente.gov.it
Eurostat, circular material use rate (dataset env_ac_cur), 2024 data released November 2025; ISPRA environmental indicator sheet on CMUR. indicatoriambientali.isprambiente.it
Circular Economy Network / ENEA, Report on the Circular Economy in Italy 2026. media.enea.it
U.S. EPA, Advancing Sustainable Materials Management: Facts and Figures (2018 data). epa.gov
U.S. Geological Survey, Mineral Commodity Summaries 2026: copper, aluminum, iron and steel scrap chapters (2025 estimates). pubs.usgs.gov
ITU / UNITAR, Global E-waste Monitor 2024 (2022 data). itu.int

© 2026 Marketing4waste - All Rights Reserved,
Marketing4Waste is a brand of MiM MarketingInterimManagers LLC
+1 801 804 5730